
NISAR, InSAR: Acronym Soup or Tasty Data?

NISAR, InSAR: Acronym Soup or Tasty Data?
Turning confusing radar terms into practical insight.
If you spend any time around Earth Observation, you’re suddenly swimming in acronyms — SAR, InSAR, NISAR — and wondering when the alphabet soup became its own language. But behind those letters is something powerful: satellites measuring tiny movements of the Earth’s surface with millimeter accuracy.
Understanding the difference between NISAR (NASA-ISRO Synthetic Aperture Radar) and InSAR (Interferometric Synthetic Aperture Radar) is the key to understanding how those measurements become meaningful.
What is InSAR?
Before we talk satellites, we start with the technique.
InSAR isn’t a satellite — it’s the method.
It compares radar images taken over time to detect movement, like a millimeter‑precision “spot the difference” puzzle.
With EO59’s workflows, that precision reaches 1–2 mm/yr, much tighter than the ~5 mm/yr achieved by large automated public pipelines.
Where NISAR Fits in the SAR Universe
To understand NISAR, it helps to see the whole radar landscape first.
Several SAR satellites are already imaging Earth, among the others:
Sentinel‑1 (ESA) — the world’s go‑to C‑band satellite for structural and surface deformation monitoring.
RADARSAT Constellation Mission (Canada) — also C‑band, excellent for covering structures and partially vegetated surfaces.
X‑band missions (TerraSAR‑X, COSMO‑SkyMed, ICEYE) — covering structures and change detection (who is where and when).
ALOS‑PALSAR (JAXA) — historically the L-band option for vegetated terrain, but lacks a readily accessible archive that would support persistent scatter products like those from EO59.
This is the stage NISAR steps onto.
NISAR: The Newcomer with a Purpose
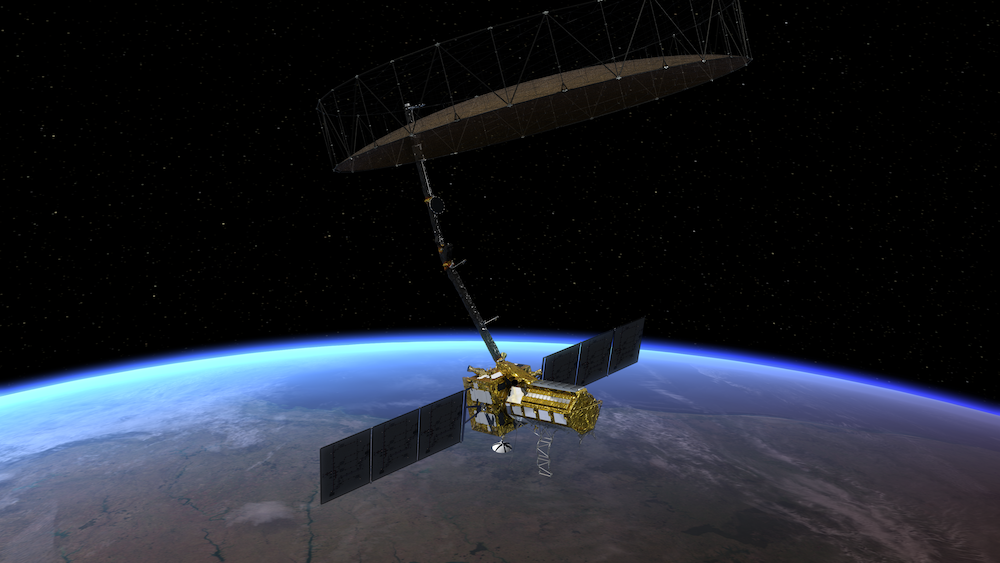
Artist’s Rendering of NISAR (https://science.nasa.gov/image-detail/amf-1ad8ddca-8d84-4a8e-abef-c731863dc742/)
NISAR is the new kid on the block and is the first (at least partially) American civilian SAR satellite mission. It is also filling a gap in the global SAR raw data realm of L and S band for vegetated areas by providing a persistent, growing archive of L‑band data.
Naturally, this larger wavelength will not support structures nor partially vegetated surfaces in the same way as its peers – yet, it provides a unique opportunity to measure things such as landslides in forested areas that are otherwise challenging. And, as its archive grows, and providers such as EO59 gain more processing time with the satellite capabilities will evolve beyond what we can presently envision.
To support the uptake of this novel data source, the publicly funded Alaska satellite facility and NASA JPL have launched a tool called the OPERA DISP and soon to be OPERA VLM. These are USA nationwide displacement and vertical land motion maps – for free! Sounds like a panacea to put all of us analytics firms out of business, right? Now you can just see how much things move, for free?! Of course, there is a light and dark side to this topic for you, dear user, and for us. The light side is that general trends over massive (think hundreds of square miles) areas are understandable. Yet, the accurate, actionable data you get from a firm like ours is what you need to understand your asset and its movement. The dark side of free tools such as this is a bit more complex for the untrained eye.
Again, this is a tremendous value for the American people to see how our technique works and how our nation’s physical surface is moving at a wide scale previously unknown to the public. Yet, just like google maps didn’t eliminate the need for timely accurate photographic imagery, this tool will not eliminate the analogue in SAR.
Why EO59 Matters When Precision Counts
Nationwide products like OPERA are excellent for seeing the broad strokes of ground movement, but real‑world decisions often depend on finer detail. That’s where EO59’s approach becomes essential.
Accuracy: Public products typically achieve around ~5 mm/yr of precision — useful for regional awareness. EO59 maintains 1–2 mm/yr, preserving subtle, early stage deformation signals that automated pipelines often smooth out.
Continuity: Public time series can pause for months at a time. EO59 keeps the record continuous, allowing slow‑moving risks to remain visible over time.
Coverage: A 30 meter grid may overlook the exact point that matters to an engineer. EO59 focuses on stable scatterers and installs corner reflectors where natural targets are insufficient, ensuring that measurements align with real assets.
Putting the Pieces Together
Taken together, the picture becomes clear:
InSAR is the technique that translates radar images into millimeter level measurements.
SAR missions each contribute different strengths.
NISAR fills a crucial gap by delivering persistent L‑band coverage in areas where satellites have historically struggled.
OPERA provides nationwide deformation awareness to the public – an important step forward in accessibility.
EO59 bridges the final gap, delivering the precision, continuity, and asset-specific insight needed for real engineering decisions.